Moving average cache locality and SIMD
When calculating moving average, two approaches come to mind: simple summation over a sliding window (ring buffer), or an incremental sum, where as new values come in, you add newVal to the total count, and remove oldestVal from it; and when you get the avg, you divide by total count. But, if you have floating point numbers, you’ll lose precision over time as you do those adds. That leads to Kahan summation.
Simple summation is O(n), whereas Kahan summation O(1). Kahan summation is obviously better for performance. But, I was mildly curious to see whether naive summation can make up the difference by making use of cache locality and SIMD.
It turns out it can not. At all. Or at least, not past a small n.
But it was fun exploring cache locality and SIMD and seeing how much performance we can eke out of a doomed battle, anyways. Let’s dive in.
Preface: All runs on a Macbook Air M3. Code available here.
Implementation
Here’s my quick and dirty implementation of the regular summing approach:
class MovingAverage {
public:
    explicit MovingAverage(size_t n) : ring_(std::make_unique<int[]>(n)), size_(n) {}

    // Given the next value, what's the new avg?
    // Regular summation.
    double next(double val) {
        ring_[cursor_] = val;
        cursor_++;
        if (cursor_ == size_) {
            full_ = true;
            cursor_ = 0;
        }
        return range_avg();
    }

private:
    std::unique_ptr<double[]> ring_; // Ring buffer.
    int size_;
    int cursor_ = 0;
    bool full_ = false;
    double sum_ = 0.0;

    // Range over ring_ and sum, then return the avg.
    double range_avg() {
        double sum = 0.0;
        int rangeTo = full_ ? size_ : cursor_;
        for (int i = 0; i < rangeTo; ++i) {
            sum += ring_[i];
        }
        return sum / double(rangeTo);
    }
};
And, here’s Kahan summation, pretty much straight out of the wiki page:
class MovingAverage {
public:
    explicit MovingAverage(size_t n) : ring_(std::make_unique<int[]>(n)), size_(n) {}

    // Given the next value, what's the new avg?
    // Kahan summation.
    double next(double val) {
        if (!full_) {
            sum_ += val;
            ring_[cursor_] = val;
            cursor_++;
            double avg = sum_ / double(cursor_);
            if (cursor_ == size_) {
                full_ = true;
                cursor_ = 0;
            }
            return avg;
        }

        // Diff of new and old, minus c.
        // This is the error corrected change.
        double y = (val - ring_[cursor_]) - c_;

        // Sum plus that error corrected change.
        // This is the sum plus the error correction.
        double t = sum_ + y;

        // New c is: Remove sum from error corrected sum. Then remove error correction.
        c_ = (t - sum_) - y;

        // New sum is t.
        sum_ = t;

        // We can replace the old value.
        ring_[cursor_] = val;
        cursor_ = next_cursor();
        return sum_ / double(size_);
    }

private:
    std::unique_ptr<double[]> ring_;
    int size_;
    int cursor_ = 0;
    bool full_ = false;
    double sum_ = 0.0;
    double c_ = 0.0;

    int next_cursor() {
        if (!full_) return cursor_+1;
        if (cursor_+1 == size_) return 0;
        return cursor_+1;
    }
};
Which is faster?
Here’s my benchmark results graphed (raw results here):
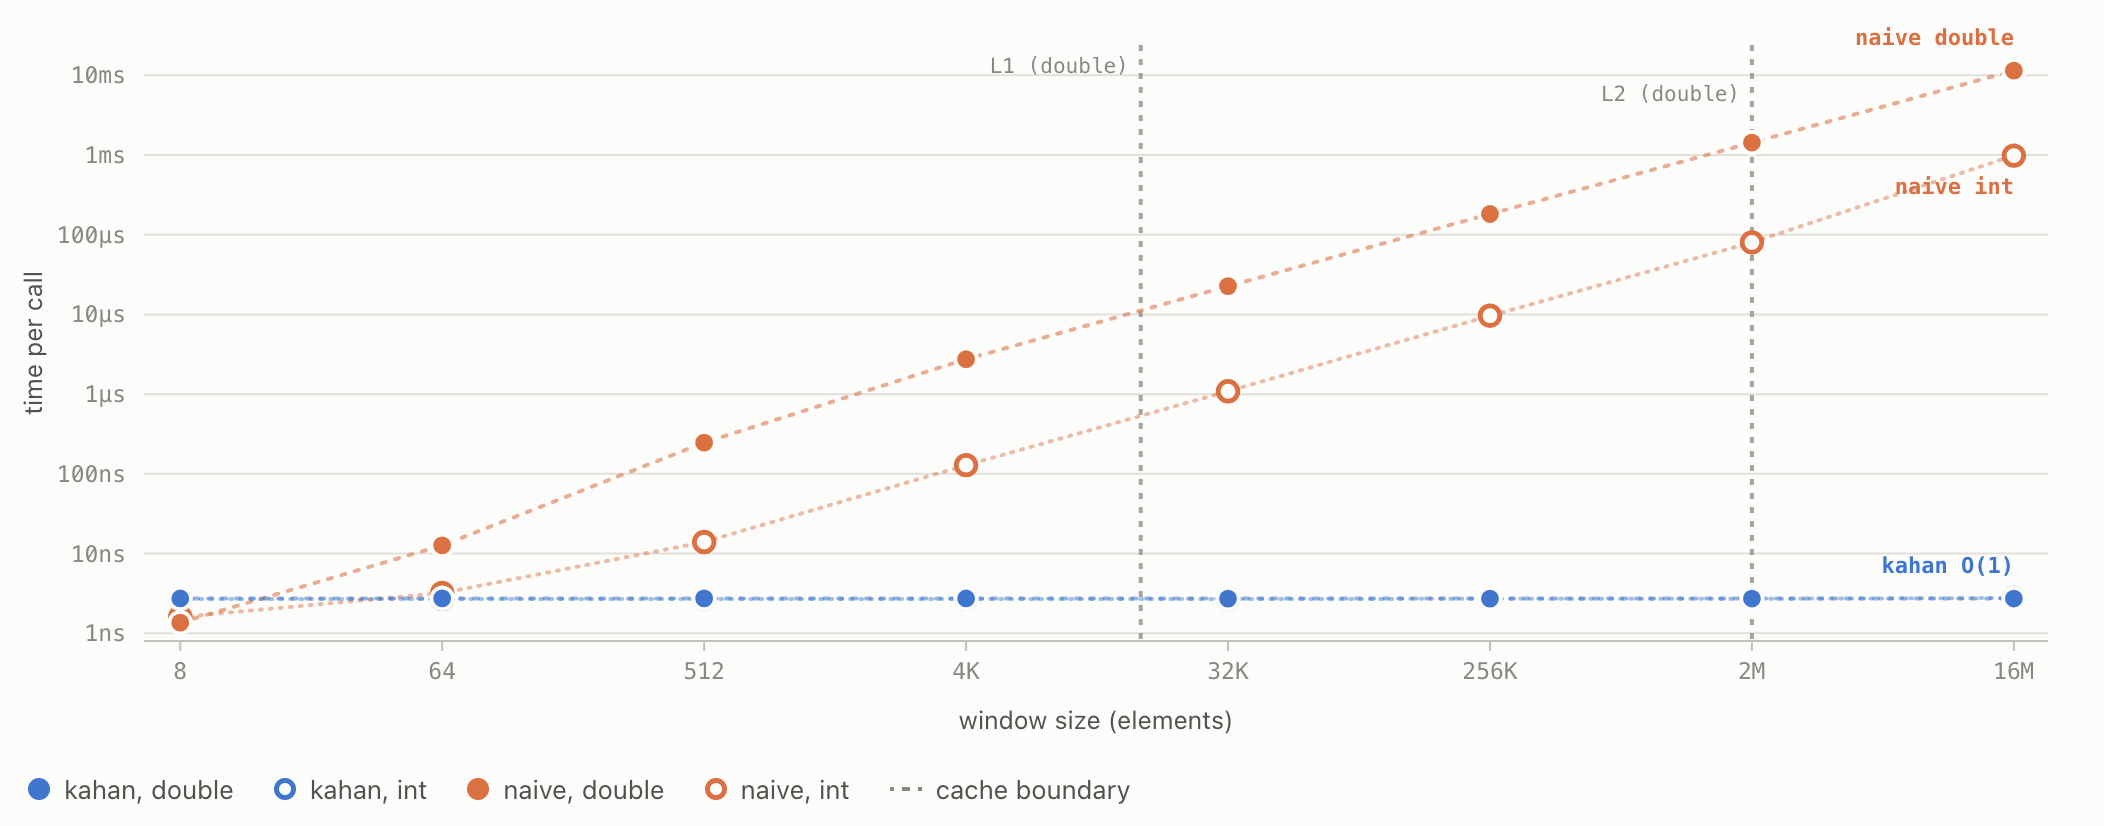
So, as expected, for larger values of n Kahan summation’s O(1) beats out simple summation.
But two things are a bit interesting here. First, using ints is quite a bit
faster instead of doubles for the simple summation (whereas no difference
for Kahan summation). Why is that?
And secondly, the cache locality effects are not really driving major speed
ups. My Mac has a 128KiB L1 cache.
In C++, doubles are 8 bytes, so we should be able to fit an array of 16,384
doubles in L1. And for ints, they’re 4 bytes, so we should be able to fit
32,768 ints in L1.
The benchmarks show simple summation falling off from Kahan summation around n=64, way before we get cache misses. What’s up with that?
Confirming cache miss behaviour
Let’s confirm that we’re actually fitting our array into L1 cache as expected.
We’d use valgrind on Linux, but since we’re on a Mac, let’s use the Instruments profiler.
You’ll need to install the full xcode and do the whole xcode-select license install song and dance. Once that’s set up, instructions to run the benchmark under the CPU / L1D cache profilers are here.
Here’s one of the benchmarks as an example:
$ BIN=./bench_out
$ FILTER='Next2_SteadyState/4096$' # "Next" refers to kahan, "Next2" refers to simple
$ xcrun xctrace record --template 'CPU Counters' --recording-options opts.json \
>   --output run.trace --launch -- "$BIN" --benchmark_filter="$FILTER" --benchmark_min_time=0.5s
Starting recording with the CPU Counters template. Launching process: bench_out.
Ctrl-C to stop the recording
Target app exited, ending recording...
Recording completed. Saving output file...
Output file saved as: run.trace
$ xcrun xctrace export --input run.trace   --xpath '/trace-toc/run[@number="1"]/data/table[@schema="MetricTable"]' | python3 l1d.py
  cycle                     7,402,673,255
  ld_uop_spec                 644,880,380
  st_uop_spec                   2,186,942
  l1d_writeback                   263,618
  l1d_miss_ld_spec                204,559
  l1d_miss_st_spec                 32,693

  L1D load miss rate:    0.032%
This shows that with n=4096, we see almost 0% cache misses. It’s in L1 the whole time, which makes sense since 4096 doubles is 32KiB, well below our 128KiB L1 cache size.
Here’s a graph of a bunch of different sizes of n:
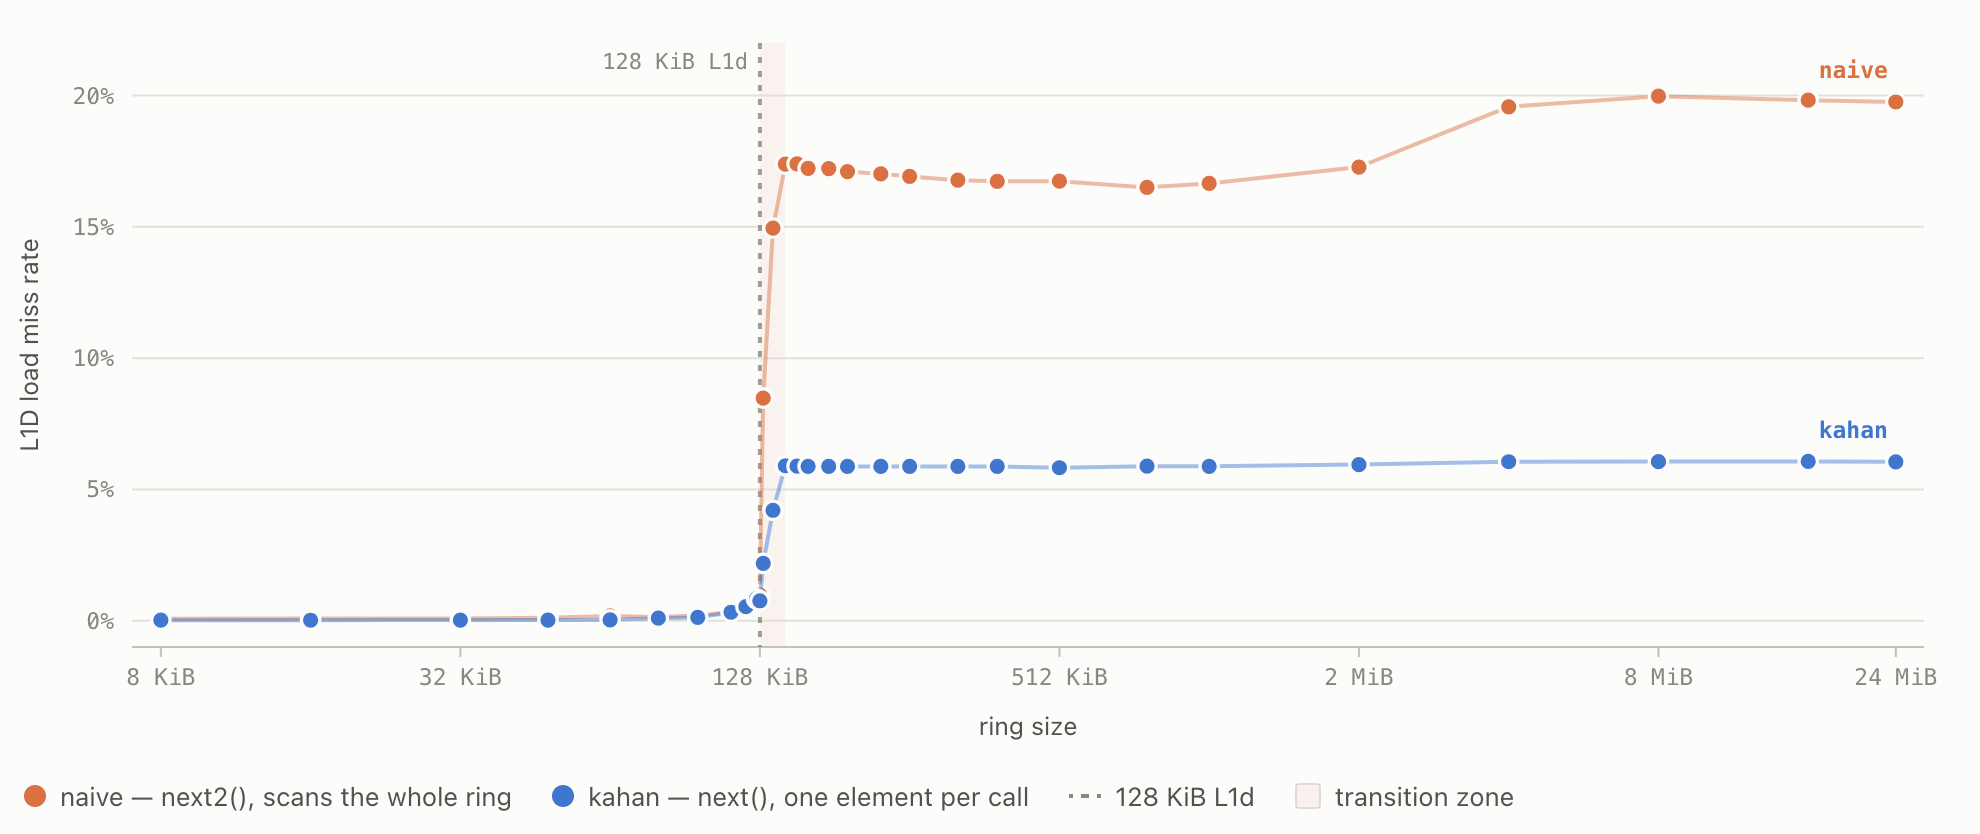
As expected, we see a large jump in cache miss rate right at the 128KiB mark.
So, we’re definitely hitting the cache until 128KiB / n=16384. So why are we seeing poor performance for n >= 16?
CPU cycles and SIMD
CPU cycles! The performance is bounded by the algorithm’s need for more CPU cycles, not by memory loading time. We’ve pretty much come full circle back to the fact that we’re talking about an O(n) algorithm vs an O(1) algorithm
There is a trick that we can play to improve performance a bit and stretch to further from n~=16 to n~=64 matching Kahan summation performance: SIMD.
And thankfully clang does this for us. Let’s take this simpler loop program:
$ cat sum.cpp
int    sum_int(const int* r, int n)    { int    s = 0;   for (int i=0;i<n;++i) s += r[i]; return s; }
double sum_dbl(const double* r, int n) { double s = 0.0; for (int i=0;i<n;++i) s += r[i]; return s; }
Compile and dump the assembly:
$ clang++ -O2 -S -o sum.s sum.cpp
$ cat sum.s
...
# int
ldp	q4, q5, [x8, #-32]
ldp	q6, q7, [x8], #64
add.4s	v0, v4, v0
add.4s	v1, v5, v1
add.4s	v2, v6, v2
add.4s	v3, v7, v3
subs	x12, x12, #16
b.ne	LBB0_7
; %bb.8:
add.4s	v0, v1, v0
add.4s	v0, v2, v0
add.4s	v0, v3, v0
addv.4s	s0, v0
...
# double
ldp   q1, q2, [x10, #-32]
ldp   q5, q6, [x10], #64
fadd  d0, d0, d1
fadd  d0, d0, d3
fadd  d0, d0, d2
fadd  d0, d0, d4
fadd  d0, d0, d5
...
We can get a bit of a hint from the compiler about what happened there by asking the compiler to give us remarks:
$ clang++ -O2 -c sum.cpp -o /dev/null   -Rpass=loop-vectorize
sum.cpp:1:58: remark: vectorized loop (vectorization width: 4, interleaved count: 4) [-Rpass=loop-vectorize]
    1 | int    sum_int(const int* r, int n)    { int    s = 0;   for (int i=0;i<n;++i) s += r[i]; return s; }
      |                                                          ^
sum.cpp:2:58: remark: vectorized loop (vectorization width: 2, interleaved count: 4) [-Rpass=loop-vectorize]
    2 | double sum_dbl(const double* r, int n) { double s = 0.0; for (int i=0;i<n;++i) s += r[i]; return s; }
      |
This is the loop vectoriser: https://llvm.org/docs/Vectorizers.html.
I don’t at all pretend to understand CPU architecture and assembly well enough, but luckily we have AI agents that can help decipher this quickly.
add.4s is an AArch64 Neon instruction.
Here’s what I’m told it gets used to do:
The v registers are 128 bits wide, and .4s means “treat that as 4 separate 32-bit ints”. So add.4s v0, v4, v0 does four additions at once — lane 0 plus lane 0, lane 1 plus lane 1, and so on — leaving 4 running totals in v0.
The two ldp (load pair) instructions pull 16 ints into v4–v7, and then four add.4s instructions consume them into four separate accumulators, v0–v3. Because no add depends on another’s result, the CPU runs all four at the same time instead of queueing them.
So each iteration handles 4 lanes × 4 accumulators = 16 ints, and the four adds execute concurrently. Afterwards, three more add.4s fold v1–v3 into v0, and a single addv.4s sums v0’s four lanes into the one number that gets returned.
It didn’t do so with double. Or rather, it did get vectorised according to the compiler, but all the additions still happened serially. Presumably clang is worried about floating point precision when adding out of order.
Either way, now we know why int is faster than double above, and also
gained some intuition about cache locality and the criticality of focusing on
algorithm runtime complexity.